Performance
| | Return History |
| | US Bonds* | Demos Strategy** | US stocks* |
| | (BBgBarc 1-5 Yr Treasury) | | (S&P 500 Comp TR) |
| 2020-06 | 0.1% | 0.8% | 2.0% |
| 2020-07 | 0.2% | 0.5% | 5.6% |
| 2020-08 | -0.1% | 1.1% | 7.2% |
| 2020-09 | 0.0% | 0.5% | -3.8% |
| 2020-10 | -0.1% | -0.5% | -2.7% |
| 2020-11 | 0.1% | 2.1% | 10.9% |
| 2020-12 | 0.1% | 0.6% | 3.8% |
| Cumulative | 0.3% | 5.3% | 24.4% |
| | Spread in Returns |
| Minimum | -0.1% | -0.5% | -3.8% |
| Maximum | 0.2% | 2.1% | 10.9% |
| Difference | 0.3% | 2.6% | 14.7% |
All returns are presented in $USD
* Source : FactSet, Morningstar, Raymond James Ltd.
** Time-weighted gross return
In our previous article on our option strategy, we briefly covered our outlook for performance and why we believe our strategy can outperform other strategies in today's environment. If you haven't watched it already, you can view the first part of our income strategy here.
In this article, we will present a concrete example of our strategy:
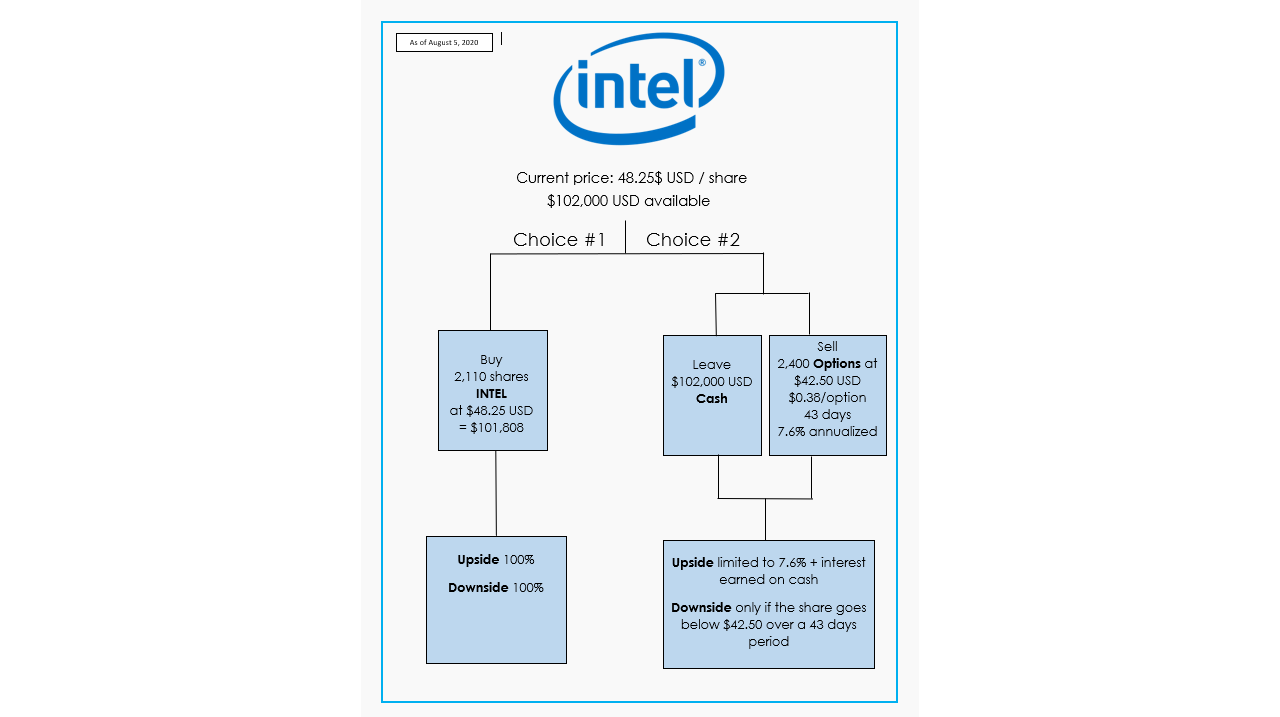
Let's say I have US $ 102,000 available and have identified that INTEL is a company that meets our selection criteria. We're going to assume US dollar amounts for this example, because the reality is that there are a lot more choices available in the US than in Canada. INTEL's stock market price is currently $ 48.25 per share. My first choice would be to simply invest my $ 102,000 right away and buy 2,110 INTEL shares at $ 48.25. This decision would allow me to participate 100% of the increase in the share price, but also 100% of the decrease in the price.
The second choice open to me is the following. Instead of immediately buying INTEL shares, I can sell options that would require me to buy INTEL shares only if its price drops to $ 42.50, which is 11.9% cheaper. So, I'm leaving my $ 102,000 in cash for now. I can invest it in a high interest savings account to receive some interest income. Then, I sell 2,400 options on INTEL with a strike price of $ 42.50 and a 43-day expiry. This means that if the price of INTEL drops below $ 42.50 in the next 43 days, I get “exercised” and have to buy 2,400 shares of INTEL at the price of $ 42.50 no matter what the market price is at that time. This is equivalent to having a total exposure of $ 102,000, or 2,400 shares at $ 42.50. So, if INTEL's price is $ 40 at the end of the month, I'm still obligated to pay $ 42.50.
You might be wondering, but why not just wait until INTEL drops to $ 42.50 to buy it instead of doing all this work to sell options? Well, because we get paid to do it! In the INTEL example, we receive $ 0.38 per option written, for a total of $ 912, which represents a return of 0.9% for the period of 43 days, or the equivalent of 7.6% annualized. The term annualized simply means that if we were to repeat this trade every 43 days for a year, we would have a return of 7.6%. You should think of selling the option as if you were selling insurance to another investor. Let's say I am the investor who pays the premium to Marc-André. Unlike him, I have 2,400 Intel shares in my portfolio which are currently worth $ 48.25 each. I am willing to take a loss of up to 11.9% per share, so if INTEL goes down to $ 42.50 or lower, I would want to sell my positions. To be sure that I can sell my positions at a minimum of $ 42.50, I am ready to pay insurance, which is the option premium, to Marc-André, who will be obligated to pay me $ 42.50 if the price of INTEL after 43 days is $ 42.50 or less.
In summary, I sell options on stocks that I would be happy to have in my portfolio but at a lower purchase price. If at expiry the share price is lower than the strike price (therefore $ 42.50 in the case of our example with INTEL), I keep the premium of $ 0.38 per option that I received at the beginning but have an obligation to buy INTEL shares from Corinne for $ 42.50 each with my $ 102,000 aside. If, on the other hand, the price of INTEL after 43 days has not fallen below the strike price of $ 42.50, I keep the premiums received and do not need to buy her shares. So, I start the process again for another period.
Company selection criteria
A very important aspect of our strategy is the selection of the companies on which we sell options. As in our regular equity model, we look for companies that meet most of our 10 selection criteria.
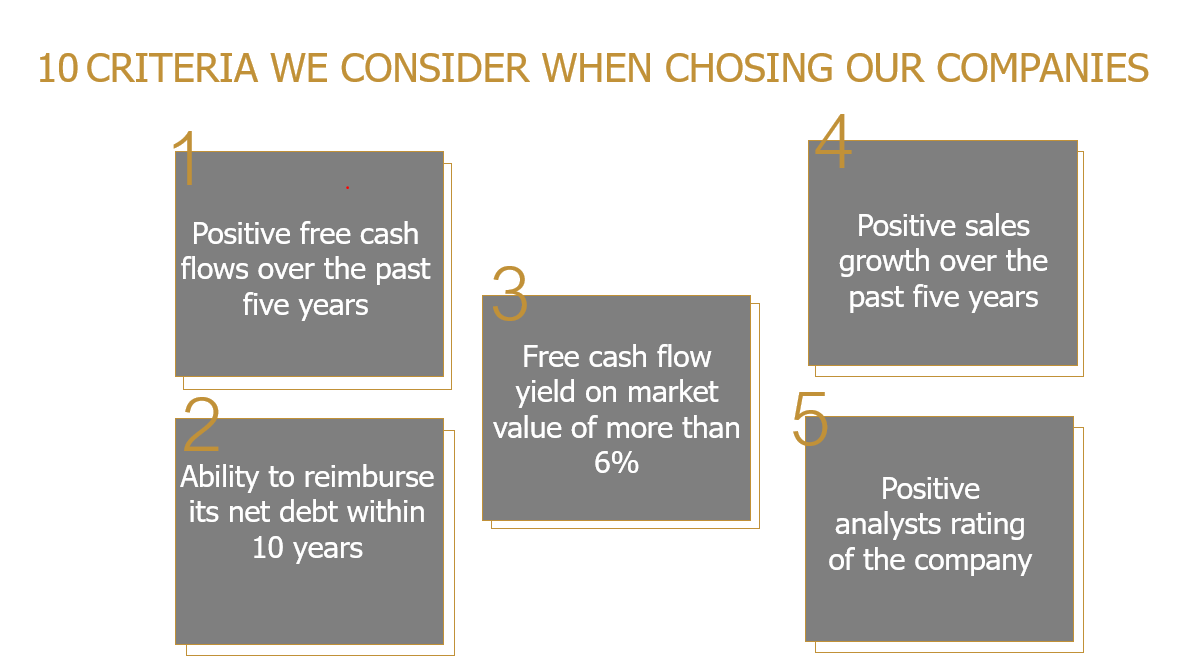
We are looking for a company with positive cash flow, an acceptable level of debt, a cash flow return greater than 6%, positive sales growth and with a generally positive recommendation from analysts.

In addition, we are aiming for historic growth in cash flows greater than the required future growth, we want dividends and share buybacks that are fully funded by cash flow and not funded by debt, stability of the management team, a sufficient daily volume of transactions and finally, we target companies with a maximum exposure of 20% to a single client.
Benefits and risks
Now let's talk about the benefits and the risks. In our previous article on options, we talked about some of the risks and rewards of our strategy.
Here are more technical details.
Going back to our INTEL example, our first choice was to just invest the $ 102,000 in stocks right away. With this choice, we participate 100% in the appreciation of the price. On the other hand, if the stock goes down, we also suffer the 100% drop. With the options strategy, it's a little different. Since we do not own the INTEL share, our earning potential is limited to the premium we receive, which in this example is 0.9% for 43 days or 7.6% annualized, in addition to interest on the $ 102,000 set aside. However, we will only have a potential loss if the stock goes from $ 48.25 to $ 42.50 over 43 days, which represents a cushion of 11.9%. It is also possible that the stock will drop below $ 42.50 and we still have to pay $ 42.50 for it.
We've been in great detail, but, again, here are the main takeaways:
- We are committed for periods of 90 days maximum.
- Companies are chosen for their fundamental qualities. We could decide to hold them for the long term.
- We are aiming for a “cushion” between 10% and 15%. So this means that we are choosing a strike price around 10% -15% below the current price.
- The premium received generally qualifies as a capital gain if you hold the option to maturity, so only half of the return would be taxable.
In closing, we believed that in the current environment, this can be the most profitable strategy given the near zero interest rates and limited appreciation in future stock prices. It is a strategy with a potentially lower level of volatility than the stock market, which has the potential to generate tax-efficient recurring income, and which can allow for tax-free withdrawals for private business owners, as we discussed in our first article.
So, if you want to know more, all you have to do is contact us directly using the contact information at the bottom of the screen. Thanks for reading and don't hesitate to share!
Please note: this strategy is only available in margin accounts, either individual or company and is subject to certain minimums.
Disclaimer
Information in this article is from sources believed to be reliable; however, we cannot represent that it is accurate or complete. It is provided as a general source of information and should not be considered personal investment advice or solicitation to buy or sell securities. Raymond James advisors are not tax advisors and we recommend that clients seek independent advice from a professional advisor on tax-related matters. The views are those of the author, Marc-André Turcot, and not necessarily those of Raymond James Investment Counsel Ltd. Investors considering any investment strategy should consult with their investment advisor to ensure that it is suitable for the investor’s circumstances and risk tolerance before making any investment decision.